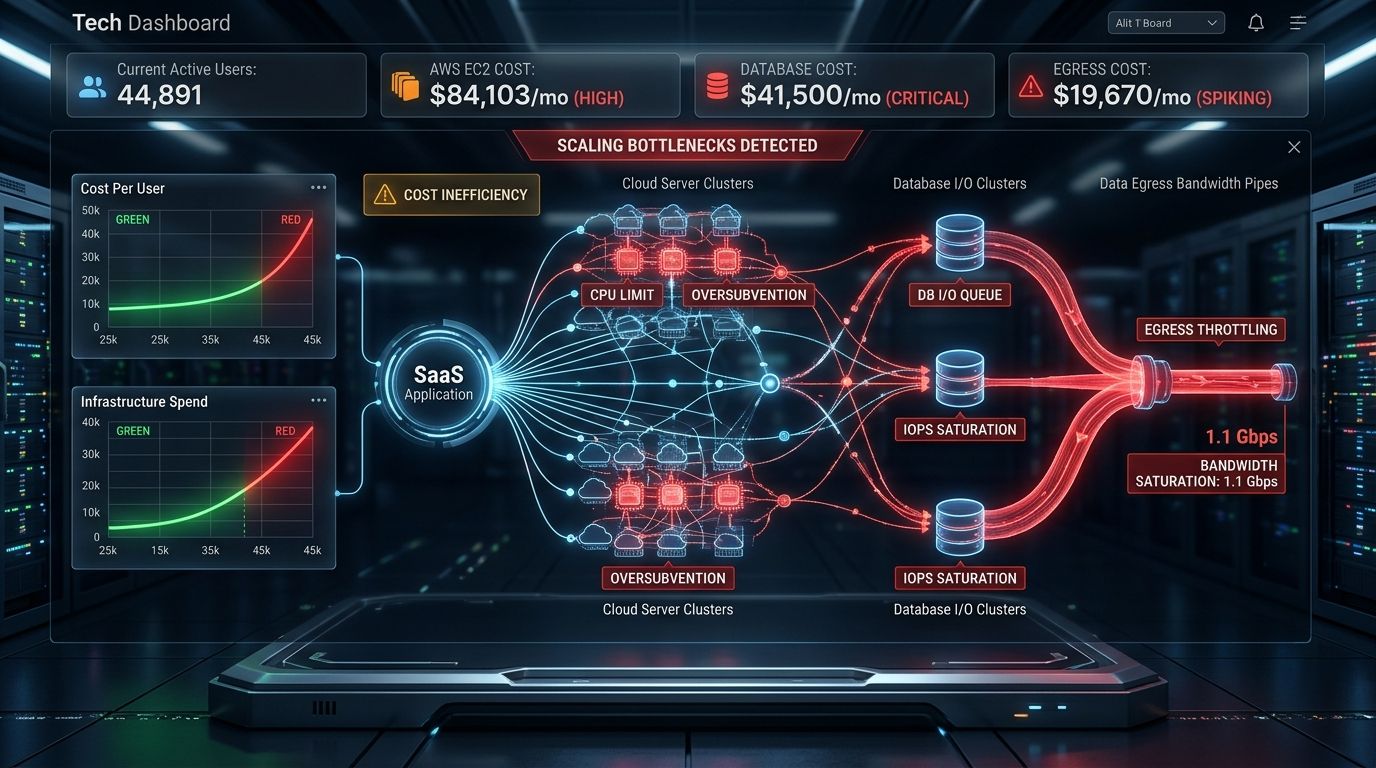
Consider a scene familiar to almost every engineering lead who has guided a cloud product through its first growth phase. Your software-as-a-service (SaaS) application launched six months ago. With its first 100 beta customers, the entire platform ran on a modest cloud footprint. The monthly infrastructure bill barely exceeded a team lunch. Response times were instantaneous, the database hummed along at four percent utilization, and leadership praised the engineering team for building a lean, hyper-efficient system.
Then traction arrived. Over the next two quarters, customer sign-ups grew tenfold, and daily active user sessions climbed higher. When the finance team reviewed the cloud invoice, however, the numbers defied every linear projection. Instead of increasing proportionally alongside revenue, the infrastructure bill had skyrocketed. Database CPU graphs showed continuous 90% spikes. Egress bandwidth costs had doubled twice in sixty days. Serverless function invocations reached into the tens of millions. Logging and observability ingestion fees arrived with an unexpected comma, and third-party API quotas for notifications and AI integrations were exhausting their monthly limits by the second week of every billing cycle.
The most confounding aspect of this crisis was that the platform was not failing. There were no catastrophic outages, error rates remained negligible, and autoscaling groups diligently spun up additional containers to absorb the surge. From an operational perspective, the software was functioning. But from an economic perspective, the architecture had become ruinous.
This reveals one of the most critical principles in software engineering: Scalability is not merely whether a system can handle more workload. It is whether the economics of that system remain sustainable while it does so.
🔍 Database Read
A single unindexed query or N+1 round-trip costs fractions of a millisecond in local testing, but melts multi-tenant database pools when executed on every navigation render.
🔄 Unthrottled Polling
A background component polling for notification badges every 3 seconds seems harmless for 10 users, but turns into tens of millions of empty HTTP round-trips for 1,000 users.
🤖 Indiscriminate AI Calls
Feeding full database profiles and document contexts into frontier LLMs for simple classification tasks generates compounding token bills with zero incremental intelligence.
📝 Verbose Logging
Logging complete JSON payloads across high-volume production endpoints consumes modest disk locally, but triggers massive cloud ingestion and indexing penalties.
Performance Scaling vs. Cost Scaling: The Hidden Divergence
When software teams discuss scalability, they almost always mean performance scaling: Can our application handle 10,000 concurrent requests without throwing 504 Gateway Timeouts? Can our database maintain sub-100-millisecond latency under peak holiday traffic?
Modern cloud infrastructure has made performance scaling deceptively straightforward. With automated container orchestration, elastic load balancers, serverless runtimes, and auto-expanding database clusters, you can easily throw raw hardware at software inefficiency. If your query is unindexed and scans 500,000 rows on every page load, autoscaling will gladly spin up three more read replicas to distribute the read load. If your client-side application triggers five duplicate HTTP requests per render, your serverless provider will seamlessly scale out 500 concurrent container instances to execute them.
The system survives, the latency graphs look acceptable, and the customer experience appears intact. But this is where cost scaling diverges violently from performance scaling. When you mask architectural inefficiencies with elastic infrastructure, you convert algorithmic flaws into monthly recurring financial obligations. A system that scales technically while scaling disastrously in cost is not a resilient platform—it is a financial time bomb.
Unit Economics for Software Architecture: Moving Beyond "Cost per Server"
Traditional IT operations evaluated infrastructure through the blunt lens of "cost per server" or "total monthly cloud spend." In modern SaaS engineering, this metric is worse than useless—it obscures the actual drivers of cloud expenditures.
Architects must think in terms of Cost per Useful Action. Depending on your business model, this might mean:
- Cost per Active Tenant: In a B2B SaaS platform (as explored in our architectural guide on Multi-Tenant vs Single-Tenant SaaS), how much cloud compute, database I/O, and storage does a typical customer organization consume every thirty days?
- Cost per Transaction / Checkout: For fintech and e-commerce platforms, what is the combined infrastructure and API fee required to process a single completed order?
- Cost per User Action / Generation: For AI-enabled applications, what is the exact token, compute, and vector lookup expenditure incurred when a user clicks "Generate Report"?
- Cost per GB Stored & Transferred: For collaboration and file-sharing tools, what does it cost to ingest, store, replicate, and deliver assets across global CDNs?
When you map architecture directly to unit economics, you gain the ability to pinpoint precisely where efficiency breaks down. If your revenue per customer is $50 per month, but an unoptimized background sync job and continuous presence heartbeat cost $14 per active user in compute and database operations, your gross margin is doomed before marketing and payroll are even accounted for.
SaaS Architecture Cost Vector Taxonomy
Infrastructure bills are composite expenditures driven by eight primary architectural layers.
- Container CPU / RAM allocation
- Serverless invocation counts
- Execution duration & cold starts
- Background worker node pools
- Provisioned IOPS & read operations
- Write frequency & transaction locks
- Storage volume & auto-expansion
- Read replicas & connection pools
- Inter-region VPC data transfer
- Public egress & file downloads
- CDN edge caching hit/miss ratio
- API payload over-fetching size
- Hot vs. Cold storage tiers
- API PUT / GET operation counts
- Media transcoding & versions
- Unpruned temporary exports & logs
- Transactional SMS & WhatsApp
- Email delivery & webhook retries
- Mapping & geocoding quotas
- Identity & payment gateway fees
- Prompt input token bloat
- Completion token generation
- Vector database index dimensions
- Excessive context window sizes
- Log ingestion GB volume
- High-cardinality custom metrics
- Distributed tracing sample rates
- Audit trail retention windows
- Concurrent WebSocket memory
- Presence heartbeat write rate
- Queue message polling & dead letters
- Event fan-out broadcast multipliers
Database Reads: The Cascade of Unnecessary Questions
In the majority of web applications, database reads outnumber database writes by a factor of ten to one hundred. Consequently, read optimization is usually the first battleground of cloud economics. Yet teams frequently misdiagnose the problem. When their relational database displays high CPU utilization, engineers often assume the database engine itself is fundamentally slow or underpowered.
In reality, the database is usually executing queries exactly as instructed; the problem is that the application is asking it the same questions millions of unnecessary times.
1. Component-Driven Request Duplication
Modern frontend architectures (such as React, Vue, or Next.js client components) encourage modular component hierarchies. A dashboard view might comprise an account header, a project summary card, a team member avatar list, a notification bell, and an activity feed.
If each of these independent components mounts and immediately fires its own separate GET request, a single user visit can trigger eight distinct API requests. Each API request initiates its own database connection, authenticates the session, queries the tenant permissions, and extracts overlapping subsets of user and organization records. Multiply this by a few thousand users navigating tabs, and your primary database server is crushed under a hail of repetitive read operations that produce identical results.
2. The Classic N+1 Query Multiplier
Object-Relational Mapping (ORM) tools provide immense developer ergonomics during early development, but their default lazy-loading behavior is one of the most prolific cost multipliers in distributed software.
Consider an endpoint designed to render a list of 100 projects in an enterprise workspace. If the ORM first queries the projects table:
SELECT * FROM projects WHERE tenant_id = 'org_492' LIMIT 100;And then iterates over each project in application code to resolve the project owner:
-- Executed 100 separate times!
SELECT * FROM users WHERE id = :owner_id;
What should have been a single joined query or two batched queries has transformed into 101 separate network round-trips and database executions. On a developer workstation with single-digit test records, this executes in 12 milliseconds. In a multi-tenant production database with millions of rows, it generates thread contention, saturates connection pools, and spikes provisioned IOPS.
Solving N+1 is not a matter of blindly applying SQL JOIN clauses everywhere, as wide Cartesian joins introduce their own memory and serialization penalties. Pragmatic engineering utilizes batch preloading (such as WHERE id IN (...)), DataLoader patterns in GraphQL or REST controllers, or carefully maintained denormalized summary fields where read volume justifies it.
3. Database Indexing: Precision over Abundance
As tables grow past hundreds of thousands of rows, query performance and cost become entirely dictated by index efficiency. When a multi-tenant application queries tasks by status and creation date:
SELECT * FROM tasks
WHERE tenant_id = 'org_128' AND status = 'in_progress'
ORDER BY created_at DESC LIMIT 20;
Without an appropriate composite index on (tenant_id, status, created_at DESC), the database must execute a sequential scan—reading thousands of pages off disk into buffer memory just to discard 99% of them. In cloud environments where databases are billed on I/O throughput or CPU utilization, unindexed queries burn capital continuously.
However, the counter-intuitive architectural lesson is that more indexes do not equal a better database. Every secondary index you add must be updated synchronously on every INSERT, UPDATE, and DELETE. Furthermore, indexes consume memory; if your total index footprint exceeds the database's available RAM buffer pool, queries are forced to fetch index pages from physical disk, destroying throughput. Engineering teams must run EXPLAIN ANALYZE on actual production access paths and index for verified high-frequency patterns, rather than scattering speculative indexes across every column.
4. Over-Fetching and the "Mega-Object" Anti-Pattern
Another silent driver of cloud expenditure is over-fetching. A frontend card only needs to display a user's name, email, and avatar URL. Yet because the backend endpoint returns the generic CustomerDTO, the serialization pipeline queries and marshals fifty database columns—including encrypted settings, billing histories, metadata JSON blobs, and audit timestamps.
This forces the database to read unnecessary blocks from disk, consumes application server memory during JSON serialization, inflates payload sizes transferred across VPC networks, and burns client-side CPU during parsing. Designing projection queries (selecting only required columns) is a trivial habit that saves significant bandwidth and compute at scale.
Database Writes: The Cumulative Weight of Micro-Transactions
While reads dominate volume, writes dominate lock contention and transaction log overhead. In relational databases (PostgreSQL, MySQL) and distributed document stores alike, write operations involve write-ahead logging (WAL), index updates, replica synchronization, and cache invalidation.
A frequent architectural mistake in early SaaS platforms is writing ephemeral, low-value telemetry directly into primary relational tables. Classic examples include:
- Updating a user's
last_active_attimestamp on every single authenticated HTTP request. - Writing heartbeat pings synchronously into a relational database table.
- Updating presence status ("user is typing...") using standard database transactions.
- Persisting analytics events synchronously inside business transaction blocks.
If 5,000 active users are interacting with a dashboard, updating last_active_at on every click generates hundreds of write operations per second against the primary user table. This fragments table storage, balloons auto-vacuum overhead in PostgreSQL, and generates massive replication streams to read replicas.
Architectural mitigation is straightforward: coarsen the update interval and decouple the write path. A user's "last seen" status does not need sub-second precision; updating it at most once every fifteen minutes in an in-memory key-value cache (or debouncing it before writing) reduces write volume by more than 95% without compromising the business utility of the feature.
The Polling Multiplier: How Small Intervals Create Massive Scale
A hypothetical calculation illustrating how slight adjustments in frontend refresh intervals transform backend workload.
With 1,000 active users open for 8 hours, querying the notifications endpoint every 12 seconds generates 5 requests/user/minute = 300 requests/user/hour.
Adjusting the interval to 60 seconds (with immediate refresh on tab focus) produces 1 request/user/minute = 60 requests/user/hour for the identical user base.
Polling vs. Realtime: Avoiding the False Dichotomy
When engineering teams realize that frequent HTTP polling is consuming tens of gigabytes of bandwidth and millions of serverless invocations, their immediate instinct is often: "We must rewrite everything with WebSockets and Realtime subscriptions."
This brings us to a crucial lesson in architectural economics: Realtime is not automatically cheaper than polling. It simply shifts the cost into a completely different set of infrastructure constraints.
The Hidden Cost of Persistent Connections
HTTP polling is stateless. The client makes a request, the server executes it, returns the response, and terminates the connection. Memory is reclaimed immediately.
WebSockets, Server-Sent Events (SSE), and bidirectional streaming runtimes maintain persistent TCP connections. Every open socket consumes operating system file descriptors and allocated memory in your API gateway or container instance. Ten thousand concurrent users idle on a dashboard consume negligible HTTP compute if they are not requesting data; those same ten thousand users on WebSockets maintain ten thousand open sockets, requiring continuous ping-pong heartbeats to keep NAT gateways from dropping connections.
Furthermore, message broadcast in realtime systems involves fan-out overhead. If an organization has 500 team members connected to a shared project board, posting a single status update requires the server to replicate and write that message 500 times across open socket connections. If those sockets are distributed across multiple server nodes, you must introduce a Redis Pub/Sub cluster or distributed message broker to route events between nodes.
The Architectural Rule of Thumb
Use Realtime where realtime provides genuine, differentiated user value:
- Collaborative document editing where users see each other's live cursors.
- Live interactive chat and urgent alerting systems.
- High-frequency trading or live logistics tracking.
For administrative dashboards, project boards, order statuses, and notification counts, a pragmatic polling strategy (e.g., polling every 60–120 seconds, pausing when the browser tab is hidden, and refreshing immediately when the window regains focus) provides 99% of the perceived responsiveness at a tiny fraction of the architectural complexity and operational cost.
Caching: Precision, Invalidation, and Multi-Tenant Isolation
Caching is often treated as a magic wand: if a system is slow or expensive, place a cache in front of it. Yet improper caching is one of the most prolific creators of data corruption and insidious security vulnerabilities in SaaS platforms.
Caching delivers economic value only when two conditions are met:
- The data is computationally expensive to generate or fetch.
- The data is frequently requested and safe to reuse across multiple calls.
Caching a database query that executes in 0.5 milliseconds and is requested once an hour adds latency, consumes Redis memory, and introduces invalidation overhead for zero practical gain. Conversely, caching a pre-aggregated monthly operational summary that requires scanning 50,000 ledger rows saves massive database CPU.
The Multi-Tenant Cache Key Guardrail
In multi-tenant SaaS platforms (as detailed in our technical discussion on Building Role-Based Access Control for Modern SaaS Platforms), cache keys must strictly incorporate tenant isolation boundaries:
-- INCORRECT: Susceptible to cross-tenant data leaks!
cache:projects:list

-- CORRECT: Strictly isolated by tenant and permission context
cache:tenant_842:projects:role_editor:list
Failing to incorporate tenant_id into cache keys can cause Tenant A to view Tenant B's confidential records upon cache hydration—a catastrophic security failure. Furthermore, security-sensitive authorization decisions (e.g., "Has this user's administrative access been revoked?") must never be cached with long Time-To-Live (TTL) values. If an employee is terminated, their revoked access must reflect immediately, not thirty minutes later when a cache entry expires.
The Request Multiplier: Behind a Single User Interaction
A single click in a browser or mobile app cascades through multiple infrastructure cost layers.
Object Storage and Egress: Moving Data Costs More Than Storing It
Cloud storage pricing has trained engineers to believe that disk space is essentially free. At a few cents per gigabyte per month for cold object storage, storing customer files, generated reports, and profile pictures seems negligible.
The unpleasant surprise arrives in the Egress (data transfer out) section of the cloud invoice. In almost all major hyperscale cloud providers, uploading data into storage is free; downloading data across the public internet to client browsers is heavily metered.
Consider a basic scenario: A company stores a 100 megabyte training video or high-resolution product catalog. Storing that file for an entire month costs less than half a cent. But if 10,000 customers download that file during a product launch, your platform has transferred one terabyte of egress bandwidth. Depending on your cloud architecture and CDN configuration, the bandwidth fee can easily exceed the storage cost by several hundred times.
Frontend Media Hygiene
The most common self-inflicted bandwidth wound is unoptimized image delivery. A user uploads a 6-megabyte, 4000×3000 pixel raw JPEG photo from their modern smartphone to serve as their profile avatar.
If your platform naively stores that 6MB file and serves it directly into an avatar container that displays at 48×48 pixels on a team dashboard with 50 members, every single user who loads that page downloads 300 megabytes of raw images. Not only does this introduce sluggish browser rendering, but it also burns hundreds of gigabytes of unnecessary data transfer across your CDN and origin servers.
Sane media architecture mandates automatic resizing upon upload:
- Transcode uploaded images into modern compressed formats (WebP, AVIF) at defined dimensions (e.g., thumbnail, display, full).
- Serve media through edge CDNs with aggressive browser cache headers (
Cache-Control: public, max-age=31536000, immutable). - Strip camera EXIF metadata to protect user privacy and shave additional kilobytes per asset.
Background Jobs and the Retry Avalanche
Decoupling slow operations from the HTTP request cycle using queues (e.g., RabbitMQ, SQS, Redis BullMQ, Kafka) is fundamental to resilient software design. When a user exports an invoice or generates an annual report, the HTTP handler returns 202 Accepted immediately, while a background worker executes the compute-heavy task asynchronously.
However, asynchronous workers introduce an economic failure mode known as the Retry Avalanche.
Suppose your worker process calls a third-party accounting API or transactional SMS gateway. The external provider encounters a temporary outage and returns 503 Service Unavailable. If your queue worker is configured with naive immediate retries:
// ANTI-PATTERN: Rapid unbounded retry
worker.on('failed', async (job) => {
  if (job.attemptsMade < 5) {
    await job.retry(); // Retries immediately!
  }
});
A single failing action suddenly spawns six external API requests within a matter of seconds. If thousands of jobs are queued, your workers flood both the external service and your own internal network with thousands of useless, failing requests. If the third-party charges per API attempt regardless of success status, your billing meter spins uncontrollably.
Production-grade job processing requires exponential backoff with jitter, strict maximum retry limits, dead-letter queues (DLQs) for unrecoverable errors, and idempotency keys to ensure that a retried job never accidentally charges a credit card or sends a customer duplicate emails.
The "Scanning the Whole World" Cron Anti-Pattern
A similar cost multiplier exists in recurring scheduled tasks (cron jobs). An application needs to identify overdue customer invoices. A junior engineer schedules a cron job to run every five minutes:
-- Runs every 5 minutes across 500,000 total accounts!
SELECT * FROM invoices WHERE status = 'pending';
At small scale with 200 records, this query completes in two milliseconds. But as the business expands to hundreds of thousands of historical invoices, this cron task queries the entire table 288 times every day, thrashing database memory caches just to discover that 99.9% of the time, zero invoices have transitioned status.
Efficient architecture replaces table-scanning crons with indexed due-time lookups (WHERE status = 'pending' AND due_date <= NOW()) or event-driven scheduling (e.g., scheduling a specific delayed execution job at the exact moment the invoice is generated). Never scan the entire world to discover that nothing changed.
Real-World Architecture Comparison: The Executive Dashboard
How architectural discipline preserves user experience while drastically slashing infrastructure consumption.
- Separate Component Requests: 8 distinct API endpoints called simultaneously on page mount.
- N+1 ORM Queries: Project list executes 101 database round-trips to resolve owner details.
- Synchronous Metric Calculation: Scans 80,000 raw sales records on every load to calculate monthly totals.
- Unchecked Polling: Notifications component polls
/api/notificationsevery 8 seconds continuously. - Raw Media Delivery: Team member avatars downloaded as uncompressed 4MB camera files.
- Synchronous Activity Write: Writes to
user_activity_logon every navigation click.
- Unified Aggregation Endpoint: 1 consolidated payload fetching initial dashboard state in a single trip.
- Batched Joins / Eager Loading: Projects and owners fetched in 1 query via indexed foreign key join.
- Materialized Rollups: Metrics precomputed every hour into a summary table; dashboard queries 1 row.
- Focus-Aware Polling: 90-second poll interval, halted when tab is backgrounded; refreshes on window focus.
- Responsive CDN Avatars: Pre-scaled 48px WebP avatars cached immutably at the edge.
- Debounced In-Memory Presence: Last-active timestamp batched in Redis and flushed every 15 minutes.
The Economics of Modern AI and LLM Features
No technical discussion of modern SaaS scaling costs is complete without addressing artificial intelligence. Integrating Large Language Models (LLMs) has become standard across software applications—from automated customer support to smart data extraction and document summarization.
However, AI introduces an entirely new unit cost paradigm. With traditional code, the marginal compute cost of an algorithm execution is measured in micro-pennies. With commercial LLM APIs, an unoptimized request can easily cost several cents per execution. Multiply that by thousands of users, and your AI bill will rapidly surpass your entire cloud hosting infrastructure.
1. "Not Every Problem Needs a Frontier Model"
The most prevalent architectural mistake in AI-enabled SaaS is routing every user prompt to the largest, most capable frontier model available (such as GPT-4o or Claude 3.5 Sonnet).
If your application needs to classify an incoming support ticket into one of five categories ("Billing", "Bug", "Feature Request", "Account Access", "General"), you do not need a trillion-parameter model with advanced philosophical reasoning capabilities. A lightweight, distilled model (such as Claude 3.5 Haiku, GPT-4o-mini, or an open-weight model hosted on inference engines) can perform that classification at 5% of the token cost and five times the speed.
Pragmatic architectures employ Model Routing:
- Use deterministic regex and string matching first: If a user types "Reset my password", don't call an LLM at all.
- Use small, fast models for classification, intent detection, and JSON extraction.
- Reserve expensive frontier models exclusively for complex synthesis, code generation, and multi-step reasoning.
2. The "Send Everything to the Model" Anti-Pattern
Context window inflation is the silent killer of AI budgets. Modern models accept 128,000 or even 1,000,000 tokens of input context. Because providers support massive context windows, lazy engineering patterns emerge:
When a user asks a simple question about an order, the backend serializes the user's entire account profile, thirty pages of historical order records, their complete support ticket history, and an 800-line system prompt, dumping 40,000 tokens into the model context for a query that only required 300 tokens of factual reference.
Because cloud AI providers charge per million input tokens, sending bloated context windows on every turn multiplies operational cost exponentially. Rigorous architectures employ targeted semantic retrieval (RAG), strict token budgets, conversation window truncation, and prompt caching to ensure that the model receives only the exact context necessary to produce an accurate response.
The 11-Point Architectural Cost Review Checklist
Before deploying any new feature or endpoint to production, engineering teams should evaluate these eleven criteria.
Distinguish between operations that execute once a day per tenant versus operations executed on every mouse movement or scroll event.
Eliminate SELECT * on high-volume tables. Return exact fields to minimize database I/O, network serialization, and client memory.
Ensure multi-tenant queries utilize selective composite indexes on (tenant_id, filter_col, order_col) rather than triggering sequential table scans.
Move presence heartbeats, keystroke events, and high-frequency telemetry to in-memory caches or debounced background flush workers.
Ensure polling pauses when browser tabs are hidden, and enforce reasonable baseline intervals (60s+ rather than sub-10s).
Do not maintain persistent TCP connections for static or slow-changing data that can be served via cached HTTP responses.
Never serve raw uncompressed user uploads directly from origin storage. Generate modern WebP/AVIF formats and enforce immutable caching.
Prevent retry avalanches on third-party API outages with strict retry ceilings, dead-letter queues, and idempotency guarantees.
Never log full payload bodies or high-cardinality debugging text across high-throughput production paths.
Use deterministic code first, lightweight models for classification, and reserve frontier LLMs for multi-step creative reasoning.
Ensure database metrics, storage usage, and API token counts are tagged by tenant_id to detect economic noisy neighbors.
The Two Architectural Phases: Pre-Launch vs. Post-Traction
A critical hazard when reading about scalability economics is falling into the trap of premature optimization. Early-stage startups that spend six months engineering distributed Kafka event streams, multi-region Redis clusters, and complex vector indexing before acquiring their first ten paying customers are burning time and capital on problems they do not yet have.
Pragmatic engineering separates technical strategy into two distinct operational phases:
- Enforce Clean Tenant Boundaries: Structure every database table with explicit
tenant_idcolumns. - Mandatory Pagination: Never expose an unpaginated
SELECTendpoint in the API contract. - Basic Selective Indexing: Add compound indexes to primary foreign keys and filter columns.
- Sensible Polling Defaults: Disallow sub-10-second polling loops in frontend components.
- Asset Upload Ceilings: Enforce file size caps and basic image resizing before saving to object storage.
- Structured Error Logging: Avoid logging entire request/response payloads in production environments.
- Protect External APIs: Place rate limits and token budgets around expensive third-party integrations.
- Cost Observability Mapping: Connect cloud billing tags directly to specific application features and tenant tiers.
- Slow Query Profiling: Use
pg_stat_statementsor APM tools to optimize the top 5 most expensive queries. - Materialized Pre-Aggregation: Move heavy reporting calculations from runtime queries into scheduled rollups.
- Edge Caching & CDN Routing: Offload static assets and public endpoints to edge networks with high cache hit ratios.
- Model Routing & Caching: Introduce lightweight models and semantic caching for high-volume AI endpoints.
- Tenant Quota Enforcement: Implement fair-use rate limiting and tiered overage fees for high-consumption tenants.
Cost Optimization Must Never Compromise Core Reliability
There is a profound difference between eliminating waste and gutting essential resilience. In desperate attempts to reduce cloud expenditures, inexperienced teams occasionally make catastrophic compromises:
- Disabling database automated backups or reducing retention windows below disaster recovery standards.
- Turning off APM and infrastructure monitoring to save telemetry fees, leaving the team blind during production outages.
- Caching security and authorization decisions carelessly, creating privilege escalation vulnerabilities.
- Under-provisioning database memory to the point where connection spikes cause immediate application outages.
- Deleting audit logs and transactional records subject to statutory regulatory compliance.
True cost optimization is not about making the system fragile. It is about removing dead weight, eliminating algorithmic inefficiencies, and ensuring that every dollar billed by your cloud provider directly supports valuable, reliable customer experiences.
Engineering Scalable Software Economics with Kamashka
Designing software that scales economically requires balancing product ambition with sound architectural realism. As we have explored across our technical series—from Multi-Tenant Architecture to Custom Software Strategy—the decisions made during early system design establish the financial trajectory of the business for years to come.
At Kamashka Technology, our engineering teams build custom enterprise software, scalable web platforms, and operational automation systems designed from the ground up for high throughput and sustainable unit economics. We believe software architecture should empower business expansion, not constrain it with exponential hosting fees.
If your organization is planning a new software platform or experiencing unexpected infrastructure bottlenecks as your system expands, explore our Software Development & Architecture Services or contact our engineering team to architect a system built to scale reliably and efficiently.
Planning to Build or Scale a Modern SaaS Platform?
Designing production SaaS demands deliberate alignment between customer requirements, tenant isolation boundaries, RBAC systems, and operational economics. Kamashka engineers scalable, resilient multi-tenant and hybrid cloud software architectures.
The Complete SaaS Architecture & Engineering Series
A 6-part deep architectural series covering tenancy models, access control, data isolation, and cloud scaling.
A comprehensive architectural evaluation of isolation boundaries, operational trade-offs, and cloud economics.
A production guide to tenant-scoped authorization, fine-grained permission models, and defensive testing.
A strategic decision guide evaluating workflow uniqueness, TCO, integration overhead, and build-vs-buy tradeoffs.
Architectural analysis of cloud cost inflection points, database bottlenecks, and early efficiency design.
In-depth implementation guide to Row-Level Security, tenant-scoped storage, cache safety, RAG retrieval boundaries, and background workers.
An architectural guide to operational readiness: safe migrations, tested restores, idempotency, observability, and failure recovery.